
How to Track High School Flag Football Stats (NFHS Format Guide)
Tracking stats for a high school flag football game is a different job than tracking a youth rec game. The NFHS format adds quarters, a zone-based field progression, live punts, penalties with multiple enforcement outcomes, three try options, and special teams stats that don't exist in youth formats. A paper stat sheet built for NFL Flag won't capture any of that accurately.
This guide covers what high school flag football stats actually include, what changes from youth formats, and how to track a complete NFHS game without losing anything.
What High School Stats Include That Youth Stats Don't
If you've tracked youth flag football before, you're used to the basics: passing completions and attempts, touchdowns, interceptions, rushing attempts, flag pulls, sacks. Those all carry over.
NFHS adds several categories that don't exist in most youth formats:
- Punts and punt returns. Every punt is a trackable event: punter, yardage, result (touchback, downed, out of bounds, returned), inside-20 punts, and if returned, returner, return yards, return TDs, and fair catches.
- Tries split by type. NFHS has three post-touchdown attempt options. The stats track 1-point tries, 2-point tries, kick extra points, and 3-point tries (custom formats only) separately. A generic "PAT made/missed" column doesn't capture this correctly.
- Field goals. Attempts and makes, with kicker attribution, tracked separately from tries.
- Scoring by player. The scoring table tracks each player's TDs, 1-point tries, 2-point tries, kick extra points, field goals, safeties, and total points. A player who scores two touchdowns and a 2-point try has a different line than one who scored three touchdowns.
- Line score by quarter. NFHS games run four quarters. The box score should show scoring by quarter (Q1, Q2, Q3, Q4, plus any OT periods), not just a final score.
None of these fit cleanly on a generic youth stat sheet. If you're going to track a high school program accurately, you need a system built for the format.
The Play-by-Play Is the Foundation
Every output (the box score, player stats, the line score, the MaxPreps export) derives from what you log on each play. That's the core idea behind using a stat tracking app instead of a paper sheet: you record what happened, and the system computes everything else.
For high school games, that means logging:
- Play type (pass, rush, punt, penalty, field goal, try)
- Player attribution (passer, receiver, rusher, punter, returner, kicker, defender)
- Outcome (completion, incompletion, TD, interception, flag pull, sack)
- Punt result (touchback, downed, out of bounds, returned, with return yards if applicable)
- Penalty and enforcement outcome (loss of down, automatic first down, replay down, declined)
- Try type and result after each touchdown
That's more inputs per play than a youth game. But it's also what creates a complete record at the end. If you skip punt yardage or try types during the game, you can't reconstruct them from a final score.
What the Live Tracker Shows During the Game
The StatHawk tracker shows the current game state at the top of the screen on every play.
![]()
The context strip shows the current period, drive number, down, and zone target. In an NFHS game you can see at a glance which quarter you're in, what down it is, and what zone the offense needs to reach for a first down. The score updates in real time as you log plays.
During the game, the play log is accessible from the tracker. Entries are readable. A punt logs as something like Punt by #6 A. Cole • 38 yds • inside 20, a penalty as Penalty: Pass Interference (Replay down), and a scored try as [2-point rush try good] appended to the touchdown entry. This gives you a running record you can glance at between plays to verify what was logged.
What You Get After the Game
When the game ends, the box score builds automatically from everything you logged.
Line Score
For a normal NFHS quarters game, the line score shows Team, Q1, Q2, Q3, Q4, and Final. If the game went to overtime, OT periods are included. The line score only appears when the app can build a reliable period breakdown from the plays. Games tracked with consistent period context will show it; older games imported without that data won't.
Stat Tables
Six player tables appear when they have data:
- Passing: completions, attempts, yards (if tracked in Yardage Mode), TDs, interceptions, sacks taken.
- Rushing: attempts, yards (if tracked), TDs.
- Receiving: receptions, yards (if tracked), TDs.
- Defense: flag pulls, assists, interceptions, sacks, forced fumbles, pass breakups, safeties.
- Special Teams: punts (PUNT), punt yards (PYDS), longest punt (PLG), inside-20 punts (IN20), punt returns (RET), return yards (RYDS), fair catches (FC), return TDs (TD).
- Scoring: touchdowns (TD), 1-point tries (1PT), 2-point tries (2PT), 3-point tries (3PT), kick extra points (XP), field goals (FG), safeties (SFT), total points (PTS).
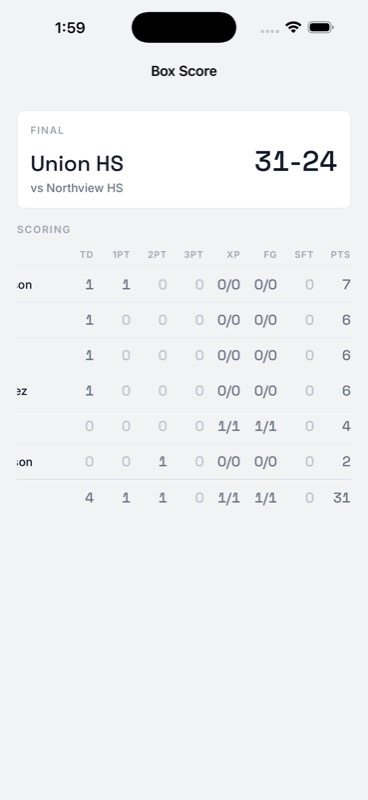
The scoring table is player totals, not a chronological play-by-play of scoring events. It answers "who scored and how" rather than "when did each score happen."
Team Stats
Team-level readouts include punts, forced punts, PAT totals, and other team-level HS-aware stats in addition to the standard passing and defensive team totals.
Game PDF
Tap Export Box Score PDF from the completed game screen to get a downloadable PDF. It includes the header (teams, final score, date, format), line score, team stats, and all non-empty player tables. This is the file you'd print for a coach binder, share with players, or keep as a permanent record of the game.
MaxPreps Export
For high school programs with a MaxPreps team page, StatHawk generates a MaxPreps-compatible stat file from any completed game. The button is labeled Export MaxPreps File and appears on the completed Game Detail screen and on the Game Over screen immediately after finishing a tracked game.
It is available for both NFHS and CIF high school seasons. The export includes the full stat parity StatHawk tracks: passing, rushing, receiving, defensive, special teams (punts, returns, fair catches, return TDs), tries split by type, kick extra points, field goals, and total points.
You export the file, then upload it manually from your MaxPreps Coach Admin account. StatHawk is a registered MaxPreps Stat Import Partner, so the file is formatted to MaxPreps spec with your program's Stat Supplier ID. For the full workflow, see How to Export Flag Football Stats to MaxPreps.
Season Stats
The Stats tab accumulates totals across every game in your season. Passing, Rushing, Receiving, and Defense tabs all update game by game. The Team tab shows HS-aware totals including punts and PAT breakdowns at the team level.
Player-level special teams and scoring tables (the per-player punt and scoring breakdowns from the game box score) are not currently in the season Stats tab. Those live at the individual game level. For a full-season special teams picture, the game-level exports are where to look.
Yardage Mode vs. Classic Mode
StatHawk offers two tracking modes. The format screen defaults new NFHS teams to Yardage Mode, which tracks passing yards, rushing yards, and receiving yards per play in addition to all the standard stats.
Classic Mode is faster. No yardage inputs, just outcomes. It works well for coaches who want a complete stat picture without entering numbers on every play. The tradeoff is that passing, rushing, and receiving yards won't appear in the box score or MaxPreps export.
For high school programs reporting to MaxPreps, Yardage Mode produces a richer export. For coaches who find the yardage inputs slow them down on the sideline, Classic Mode still captures everything else correctly.
What a Paper Stat Sheet Can't Do
A printed stat sheet for NFHS flag football can capture most of this if someone fills it in carefully. The problems are practical:
- You need one person dedicated to the sheet. During live punts with returns, penalty enforcement decisions, and three-option try selections, keeping a paper sheet current requires attention that the coach often can't spare.
- The sheet doesn't compute anything. Try splits, total points, line score by quarter, and MaxPreps-formatted columns all have to be calculated manually after the game.
- The data stays on paper. It doesn't accumulate into a season totals view or export to MaxPreps without someone re-entering it.
A stat tracking app handles the computation, accumulation, and export automatically from the same inputs you're already recording during the game. The sideline job is logging plays. Everything else follows from that.
Getting Started
Set up your team in StatHawk, select 7v7 Girls High School (or Boys), and track your first game. The app walks through team setup, roster entry, and game scheduling before you ever reach the tracker.
The first game will feel slower than a paper sheet while you learn the flow. By the second or third game, the inputs become fast enough that one coach can handle tracking and coaching simultaneously, or hand the phone to an assistant for dedicated tracking.
Download StatHawk free on the App Store and have your team ready before the season starts.
Keep reading
- NFHS Flag Football Rules Explained for High School Coaches: game structure, zones, punts, and penalties.
- How Scoring Works in High School Flag Football: tries, kick extra points, field goals, and overtime.
- How to Export Flag Football Stats to MaxPreps: submit tracked stats to your team's MaxPreps page.
Track your team with StatHawk
StatHawk is the free iOS stat app built for flag football coaches: live tracking, full box scores, and a shareable link parents can follow from anywhere. Want player analytics and AI recaps? See StatHawk Pro, or download free on the App Store.
Track your team with StatHawk
StatHawk is the free iOS stat app built for flag football coaches — live tracking, full box scores, and a shareable link parents can follow from anywhere. Want player analytics and AI recaps? See StatHawk Pro, or download free on the App Store.